


Bitcoin Precariously Balanced as Bears Eye Further Decline
Once again, Bitcoin's price started a downward trend below the $73,800 barrier and can continue its decline if it drops below $72,500. On Monday morning Asia time, after an unusually quiet weekend, the price of Bitcoin was about $73,441, marking a 3.7% fall over the week.
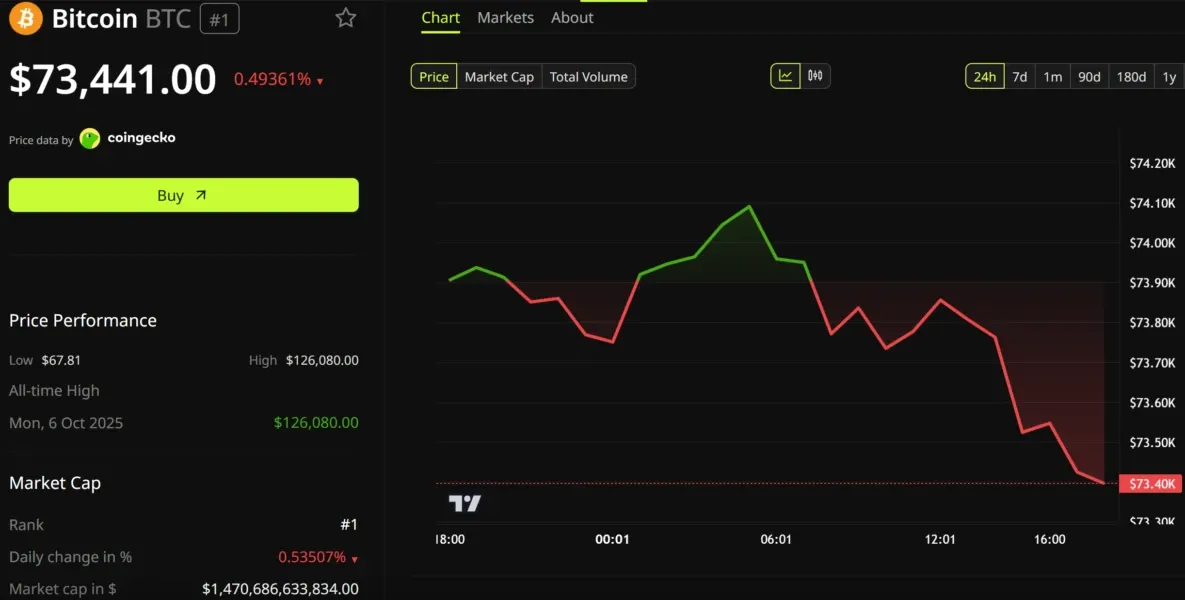
According to TradingView, beyond the $23.6 Fibonacci retracement level of the fall from the $77,810 high to the $72,470 trough, there was a slight rise. The price has lately attempted to recover from its low point of $72,470.
For the top token, the obstacles came around $74,000. The hourly Bitcoin/USD chart has revealed a drop below an upward channel, with $73,550 marked as support.
At the moment, Bitcoin's price is below $73,800, which is below the 100-hour simple moving average. It could try to start a fresh uptrend if the price stays over $72,000. Near the $73,850 level, there is immediate resistance.
The first major obstacle is close to the $74,000 level. The price has the potential to reach new heights if it breaks past the $74,000 barrier level. Under these conditions, the price has the potential to rise and test the $74,500 level of resistance.
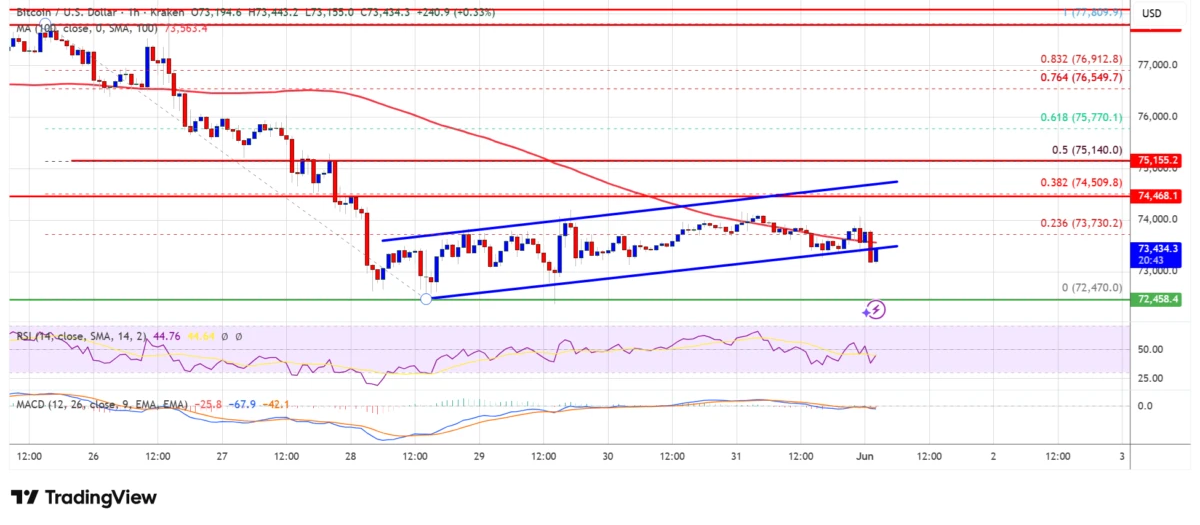
If prices continue to rise, they may reach $75,150, which would be the halfway point of the $72,470–$77,810 price range.
This is the 50% Fibonacci retracement level. Perhaps $75,500 will become the next obstacle for the bullish trend. A new downtrend can begin if Bitcoin has trouble breaking through the $74,200 barrier. Nearly $73,000 is available for immediate relief.
Around the $72,500 mark is where you'll initially see considerable support. At the moment, we are looking at the $72,000 mark as the potential next support level.
If prices keep falling, they may reach the $71,500 support level soon. At present, $70,850 serves as the principal support level; a decline below this level may make a short-term rebound for BTC more difficult.
New Moves After 16 Years
A Satoshi-era Bitcoin wallet that had been dormant since August 2010 finally sprang to life on Sunday, transferring 20 BTC, ending a total of 15.8 years of inactivity.
Onchain analysts took notice of the move immediately because of its high value – about $1.47 million at current pricing. Block 951828, mined at 05:14 UTC on May 31, 2026, was the first to be detected by Galaxy Research. The value of Bitcoin decreased by 0.3% for the day, reaching around $73,608 throughout the transfer period.
Coins were last sent to the address starting with '1CDSyXAQxro4FPUoqAQb' about sixteen years ago. This puts the wallet at the very beginning of the Bitcoin mining process.
At the time, just a small number of passionate individuals ran the network, and CPU mining was commonplace.
The head of Galaxy's research team, Alex Thorn, quickly dismissed any connection to Satoshi Nakamoto.
In order to distinguish between other early wallets and potential Satoshi clusters, Galaxy use on-chain analytic tools. This sum of 20 BTC does not match any of those profiles.
There have been some movements in 2025 and 2026 that are similar to the Satoshi-era miners, but they have seldom affected the market.
Twenty Bitcoins doesn't seem like much when weighed against the roughly $16.3 billion in daily spot trade of Bitcoin.
Nearly 4% of the token's value has been lost in the previous week, bringing the 30-day total down to 6.2%.
The key factor that determines market movements is still macro trends. Reactivating a dormant miner wallet followed a similar pattern, with no impact on pricing.
With the price increase, the slow but steady movement of Bitcoin from its original owners has accelerated. Earlier this year, there was a transaction involving 80,000 BTC that quietly moved coins to exchanges.
Whether this anonymous owner decides to sell, merge, or just switch to a more modern address format is anyone's guess.
Listing the 20 BTC on an exchange is the only way to reveal the answer. The move is influencing the Bitcoin market for the 2026 cycle as long-term holders rebalance their holdings.
Conviction vs. Hype
Cryptocurrency and its other markets dedicated the week to distinguishing genuine belief from mere excitement.
Bitcoin has managed to overcome concerns about sell-offs and has elevated its long-term support level, despite the backdrop of a $500 million AI expenditure and a significant 50% decline in stocks, which highlight the rapid unravelling of speculative investments.
The division extended across the week's most prominent figures.
SpaceX secured a significant $2.29 billion defense contract, while Bitcoin investors capitalized on market dips. Meanwhile, concerns arose from escalating AI expenditure and a disappointing sports event in Las Vegas, providing a note of caution.
After a week that tested investors' emotions more than its support levels, Bitcoin is now trading at about $73,600.
Just hours after depositing 411.5 BTC worth almost $30 million into Coinbase Prime, major corporate holder MicroStrategy withdrew the funds.
There had been no direct exchange activity for about two years prior to the deposit.
New information has put an end to rumours that Michael Saylor is trying to set up a sale. The odds of a sale in 2026 have decreased slightly but are still high.
The company has not bought any more Bitcoin since May 18 and now has 843,738 BTC in its possession.
Tom Lee’s BitMine capitalized on the market dip, acquiring 25,000 ether for a total of $50.6 million.
The present price patterns are less steady than the broader structure.
From an initial value of $60,000 in early May, the 200-week moving average of Bitcoin has increased and is now above $61,000.
On May 30, the action was emphasized by Blockstream CEO Adam Back as a promising sign for the future.
The average has shown the bottom of every cycle that has come before it and smooths out roughly four years' worth of weekly closing.
A weekly closing below it occurred only in the 2022 bear market.
The current market price of Bitcoin is almost $12,600 higher than the rising support level, which is around $73,600.
Ether vs. Bitcoin
According to an in-depth examination conducted by Ethereum developers, the 65% drop in ether's value compared to Bitcoin since the Merge is due to specific execution failures within the Ethereum Foundation, not market trends or coordination problems.
Indictment details include names, dates, and instances of delayed product releases; it characterizes underperformance as an accumulation of execution debt.
Reid, an Ethereum developer and participant from the ICO era, revealed the document.
There is congruence between Reid's main data point and what is accessible in the public markets. At its peak in September 2022 during the Merge, the Ethereum-to-Bitcoin ratio was about 0.085.
It showed that ether was not performing as well as Bitcoin by late May, when it dropped to around 0.028. With a 21% drop in value over the past year, Ether is now worth less than $2,000 at the market price.
Reid disagrees with Bankless co-founder David Hoffman's assessment of ether's "deserved cap," saying that the restriction is not praiseworthy.
He argues that the cap is lower than the optimists expected, and he provides concrete examples, dates, and reasons to back up his claims, rather than depending on abstract theories.
Reid discloses that he has a long position in ether and focuses on credit and physical assets at firms like Figure and Securitize.
According to Reid, investors were led astray by claims of a 99.95% drop in energy use after hearing about the Merge.
Companies wanted their money back, construction companies wanted their problems solved, and shoppers wanted to save money.
At the same time, Solana highlighted how fast it was.
It took seven years to develop proof-of-stake, which was detailed in the roadmap in 2015.
Solana introduced its mainnet beta in March 2020, successfully delivering wallets, decentralized exchanges, and money markets, all while Ethereum was still engaged in discussions about specifications.
CME-Gap Free Monday
Bitcoin embarks on its inaugural full trading week without the CME futures chart gaps. Market participants depended on an eight-year trend to predict short-term price objectives, but recent changes have put an end to that strategy.
On May 29, the Chicago Mercantile Exchange transitioned to continuous trading for its regulated cryptocurrency futures and options. With this adjustment, the weekend lulls that had led to noticeable price discrepancies since the introduction of Bitcoin futures in December 2017 were eliminated.
While spot markets and offshore perpetual markets kept running for nearly nine years, CME Bitcoin futures stopped trading every weekend.
Futures markets would have a gap in their charts if there was a change over the weekend. Price would often return to that level a few days or weeks later. Fill rates in the past ranged from 70% to 90% or more. For short-term shifts in the bitcoin market, the trend has become a much-studied indicator. Furthermore, institutions had difficulties due to the structure, as they were not permitted to make weekend modifications to hedges on a controlled platform.
CME currently runs six more contracts continuously in addition to Bitcoin, Ether, and Solana. On weekdays, maintenance lasts two minutes, while on Saturdays, it lasts two hours longer.
Asset managers, ETF providers, and corporate finance departments now have a way to manage weekend exposure in real time that is compliant, and it's effective.
This expansion follows exceptional participation in CME crypto offers in 2025, which set a new bar. On June 1, a new instrument called Bitcoin volatility futures will be launched. This contract will track the 30-day implied volatility.
There are still three unfilled legacy gaps. One is in the $67,000 to $70,000 range, while two are located above the present price, about $78,500 and $80,000. As we enter the post-gap era, the first true test will be whether or not those gaps continue to influence continuing trade. On Monday, the amount of open interest and early CME offers will show how fast institutions change their strategies.
What Other Technical Indicators Show
TradingView's technical analysis overview for the week ahead, based on key data from moving averages, oscillators, and pivots, showed a sell signal.
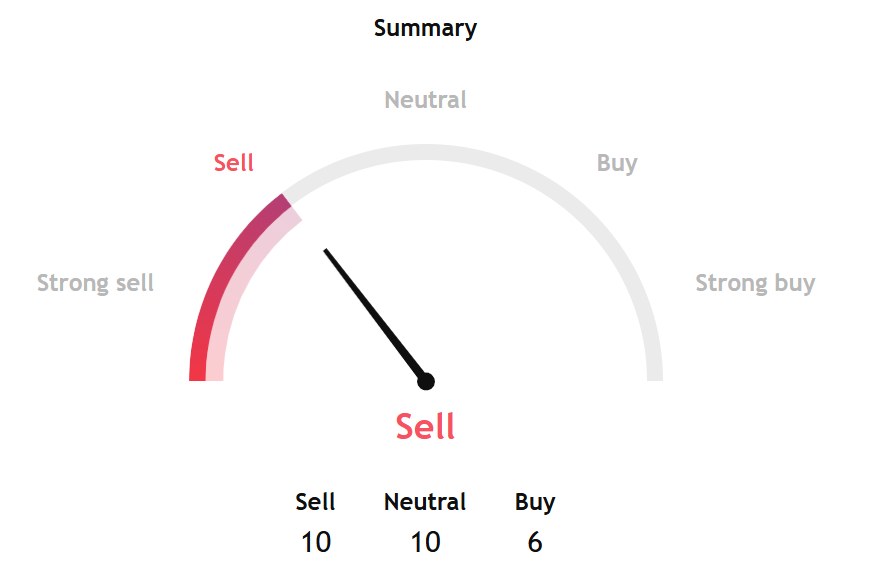
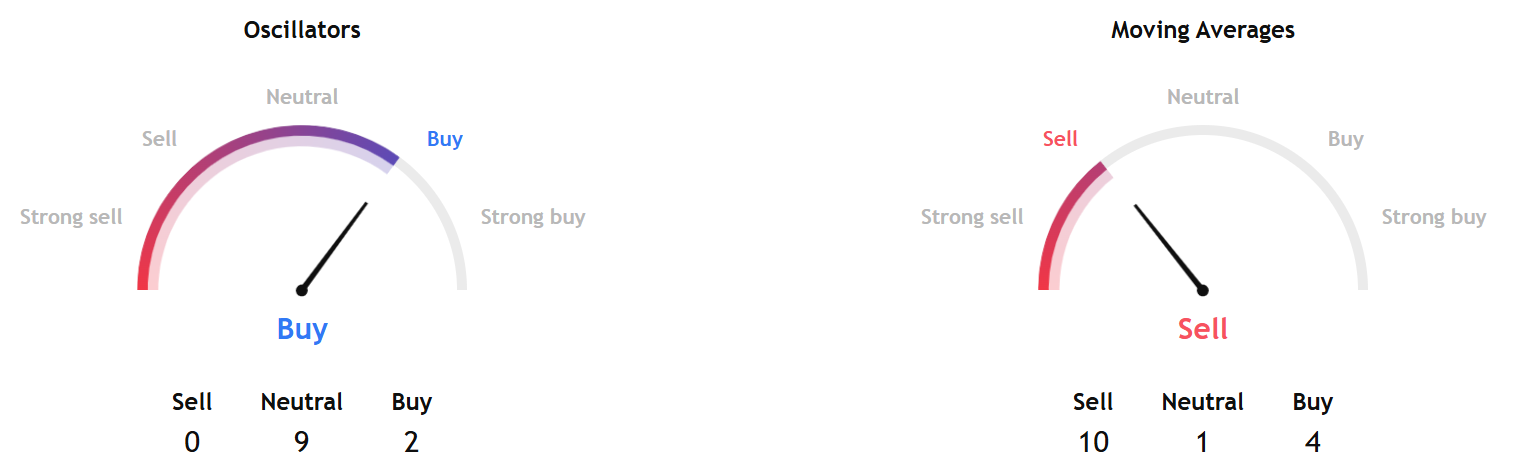
Indicators measuring Moving averages supported the overall sell signal, while oscillator measures pointed to a buy signal.
Separately, InvestTech's Algorithmic Overall Analysis and one to six weeks' recommendation gave a negative score, saying that Bitcoin "is in a falling trend channel in the short term" and noting this "shows that investors over time have sold at lower prices to get out of the token, and indicates negative development for the cryptocurrency."
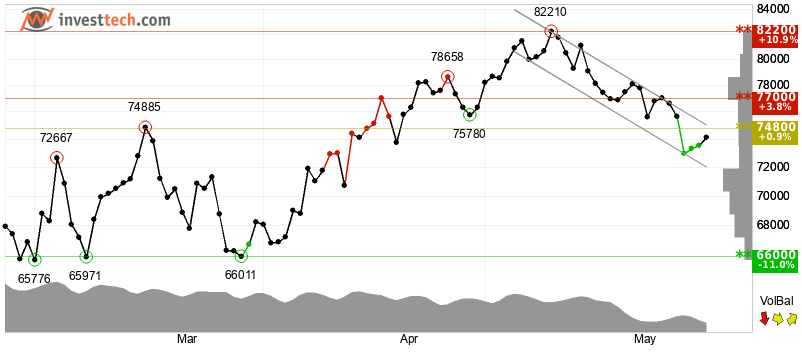
InvestTech added, "The token is approaching resistance at $74,800, which may give a negative reaction. However, a break upwards through $74,800 will be a positive signal. The crypto is assessed as technically negative for the short term."
Content Original Link:
" target="_blank">


