


More Pain Ahead? Bitcoin and Ethereum Charts Show Mixed Signals: Analysis
In brief
- A Bitcoin whale sale over the weekend stopped the Bitcoin rally in its tracks.
- Technical indicators suggest caution ahead for BTC traders.
- There are signs, though, that markets are taking a more optimistic view of Ethereum.
The crypto market has started the week off in a sea of red after a massive Bitcoin sell-off from a single whale triggered cascading liquidations across the board.
It’s a reminder that studying trends and cautiously reviewing charts can only take you so far in the volatile world of crypto assets. Every now and then, unforeseen events—a black swan, or a big red whale—can flip the script in an instant.
It was just three days ago, on Friday, that Federal Reserve Chair Jerome Powell sent risk assets soaring after he opened the door to rate cuts during a speech at Jackson Hole. Since then, total market capitalization in crypto has plummeted to $3.83 trillion, down 2.4% in 24 hours.
The $2.7 billion dump that triggered those liquidations over the weekend had such a large impact, Bitcoin charts are showing signs of weakness for the first time in a long while. Interestingly, however, Ethereum—the second largest crypto asset in the market—appears to be weathering the storm.
Bitcoin (BTC) price: Trend weakness signals caution
This massive Bitcoin sell-off over the weekend pushed BTC down to a key support zone near $113,000, with over $846 million in leveraged positions forcibly closed—mostly punishing overly optimistic long traders.
Bitcoin opened the day at $113,491 but quickly tumbled to a low of $110,584 before settling at $112,429—a 0.92% decline today and more than 2% in the last 24 hours. The flagship cryptocurrency briefly tested the psychologically crucial $110,000 support level and was able to bounce back before triggering automated selling from algorithmic traders.
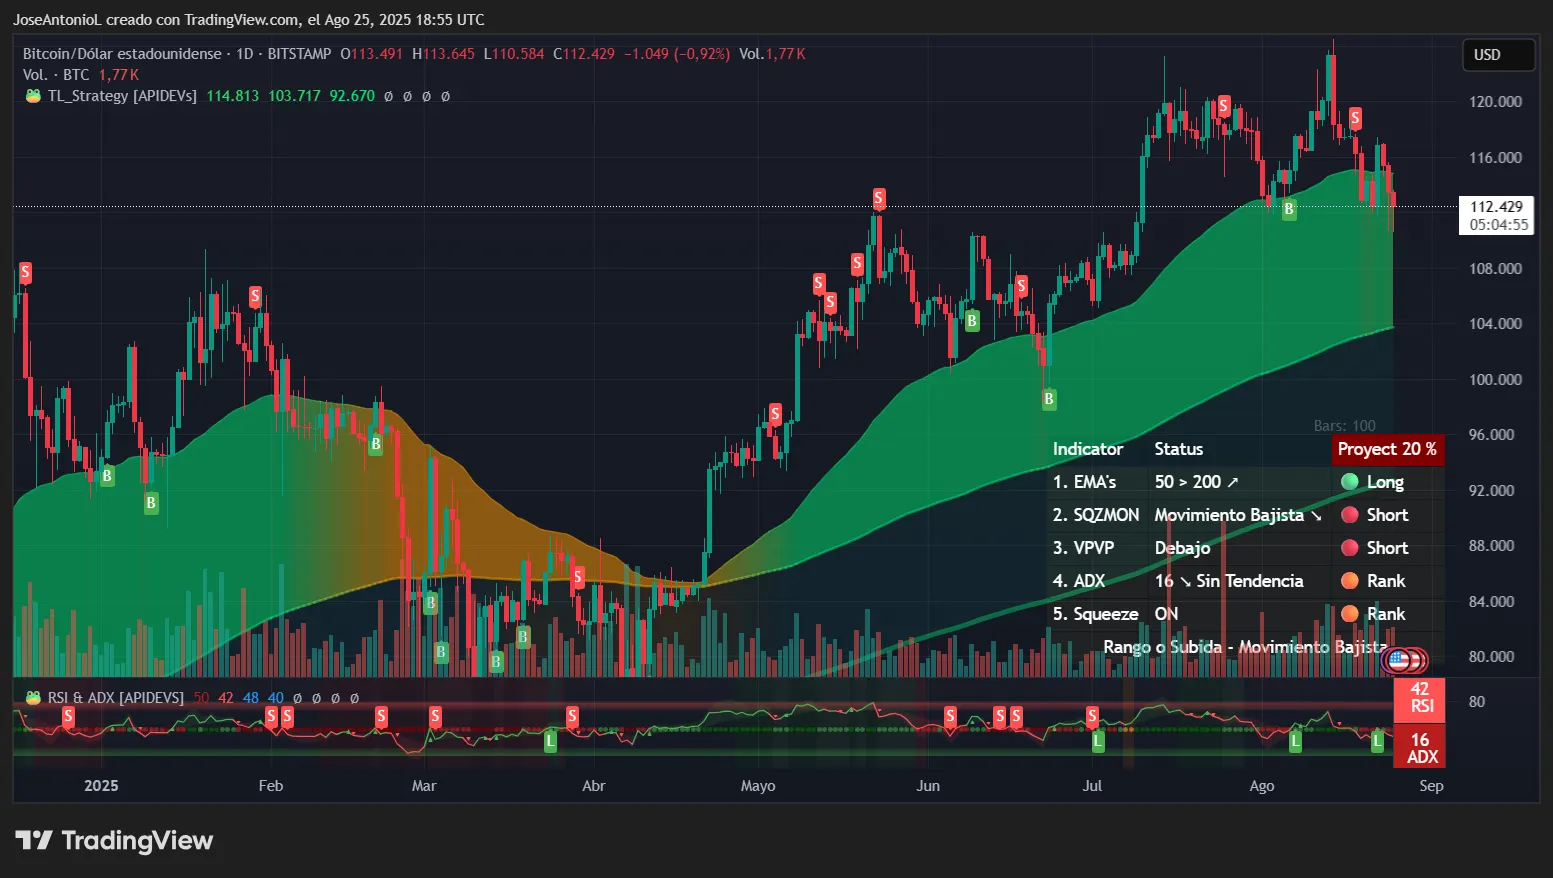
There’s no other way to slice this, though: The technical picture reveals weakness.
Bitcoin’s ADX, or Average Directional Index, sits at a feeble 16, well below the 25 threshold that confirms trend strength. ADX measures trend strength regardless of direction on a scale from 0 to 100. This reading tells traders that Bitcoin's current price action lacks conviction—think of it as a car engine sputtering rather than roaring.
When ADX readings remain below 20, markets typically enter choppy, directionless phases that frustrate both bulls and bears, making it easier for FOMO and FUD episodes to trigger big movements.
The Relative Strength Index, or RSI, at 42.48 has dipped into bearish territory. RSI measures momentum on a scale of 0-100, where readings below 50 indicate selling pressure outweighs buying interest. At 42, Bitcoin is approaching oversold conditions (below 30), which usually indicates that short-term traders might start looking for bounce opportunities—though catching falling knives remains a dangerous activity.
The Squeeze Momentum Indicator shows "on" status, signaling that volatility compression is building. Combined with the weak ADX, this would normally suggest to traders that they should prepare for a significant directional breakout. But the current price action hints it could be downward.
But bulls might find solace in the exponential moving averages. EMAs provide a view of price supports and resistances based on the average price of an asset for a set period of time. And for Bitcoin, the EMA picture remains bullish longer-term.
Bitcoin’s current price is still trading above the 200-day average (green zone in the chart above), but the gap is narrowing slightly, showing that bulls are pushing the brakes. This is critical because day and swing traders often use these EMAs as a line in the sand—a break below could trigger systematic selling from funds programmed to exit positions when long-term trends turn negative.
It’s clear, though, that the sentiment around Bitcoin has shifted quite dramatically—and quickly. On Myriad, a prediction market developed by Decrypt’s parent company Dastan, traders no longer believe Bitcoin hits $125K before dropping back down to $105K. The odds on this market have flipped repeatedly over the last week. And they swung wildly over the weekend: from 67% favoring the “moon” scenario of $125K, to now 60% favoring the “doom” outcome of $105K.
Key Levels:
- Immediate support: $110,500 (today's low)
- Strong support: $107,000-$107,600 (psychological level and previous price testing zone)
- Immediate resistance: $116,000 (recent consolidation zone)
- Strong resistance: $120,000 (previous consolidation zone)
Ethereum (ETH) price: Heavy selling despite bullish signs
If a Bitcoin whale unloading $2.7 billion in a single clip wasn’t wild enough, Ethereum just went through a rollercoaster of its own.
From hitting a new all-time high price of $4,946 on Sunday to… well, where it is now, already 10% off that mark.
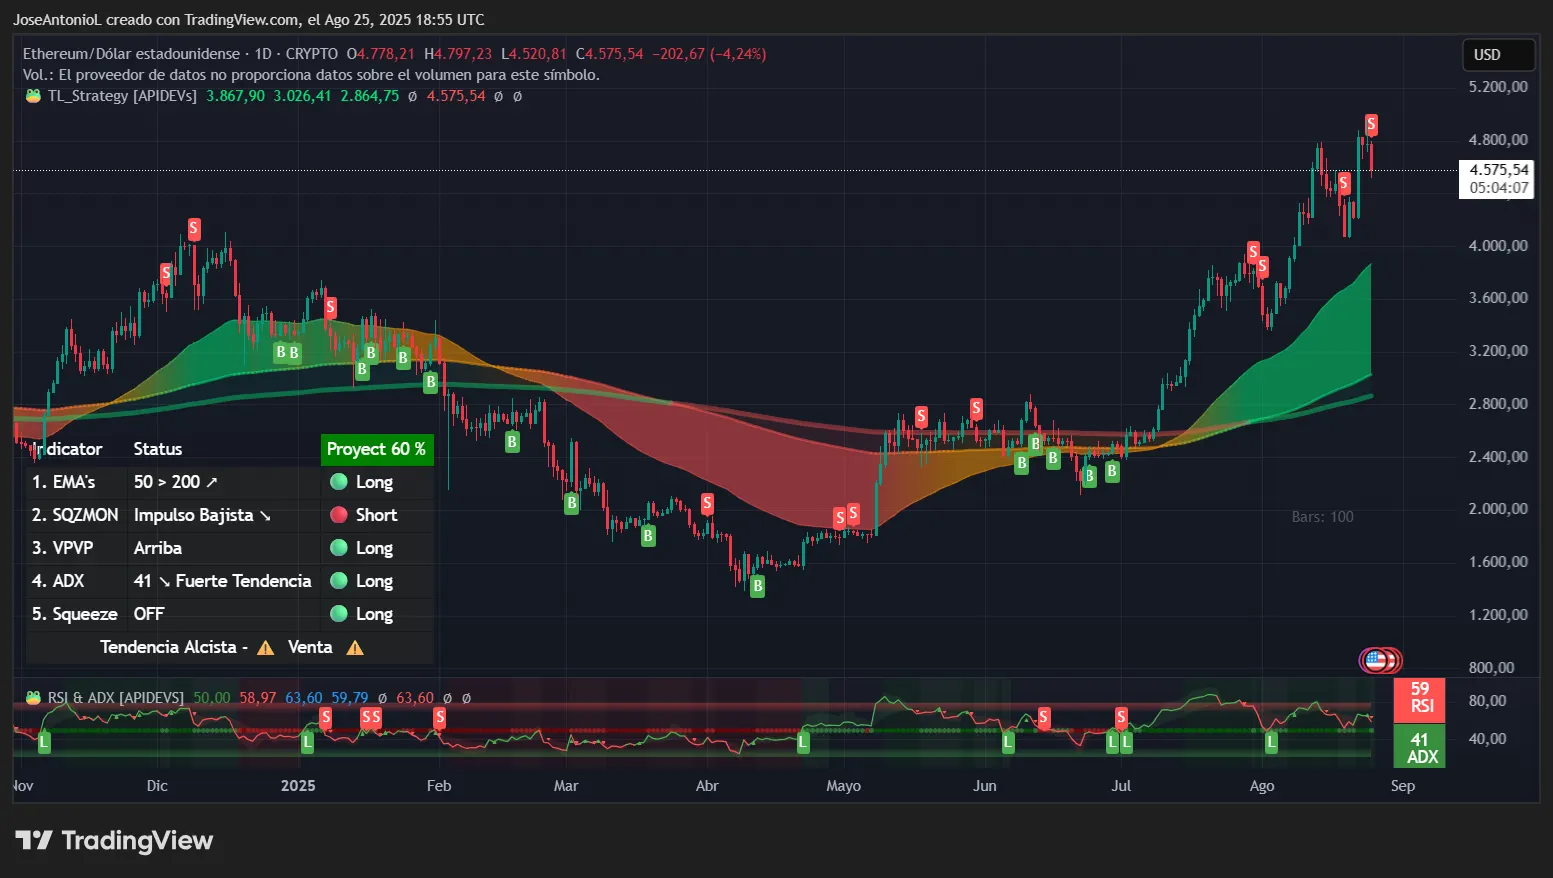
After an up and down day, opening near $4,800, Ethereum is currently trading for just above $4,400. The sharp rejection from near the $4,800 resistance level suggests profit-taking intensified as ETH registered its recent all-time high.
But despite the selling pressure, technical indicators suggest the market is still optimistic.
Ethereum’s ADX is at 41. This elevated reading—well above the 25 trend confirmation level and into the 40+ "extremely strong trend" zone—indicates powerful directional movement.
The RSI at 58.97 remains in neutral territory, which might seem contradictory given today's sharp decline. This disconnect occurs because RSI smooths price action out over multiple periods (typically 14 days), meaning today's drop hasn't fully filtered through the calculation yet. Also, a significant dip like the one ETH just experienced cools down trend strength, which is good news for tactical traders as it opens up more room for growth over the long term.
The Squeeze Momentum Indicator suggests volatility in the ETH market has already been released. When this indicator transitions from "on" to "off,," it typically means the market has already made its big move and might enter a consolidation phase. For swing traders, this suggests waiting for the next squeeze setup rather than chasing the current move.
The 50-200 EMA spread remains decisively bullish with an expanding gap, with both averages trending upward and the current price trading above them. Even today's sharp decline failed to bring ETH dangerously close to testing the 50-day EMA support.
Perhaps that’s why traders on Myriad still expect Ethereum to hit $5,000 before the end of the year. Myriad users currently place those odds at 79%—though that’s down quite a bit from the 90% odds just yesterday.
Key Levels:
- Immediate support: $4,400 (round low)
- Strong support: $4,194 (support after the last breakout)
- Immediate resistance: $4,954 (all-time high)
Disclaimer
The views and opinions expressed by the author are for informational purposes only and do not constitute financial, investment, or other advice.
Content Original Link:
" target="_blank">


